Topology
The topology view, in Visualization > Topology, represents the different resources through a graph. It allows for better data visualization to quickly get the global portrait of an attack surface.
By simply selecting a project, searching a resource and selecting it, you can get a quick overview of its attack surface. Selecting a resource in the graph will also provide you with an preview of its data.
The graphs are by default generated with a depth of 5, but you can specify the depth that you want.
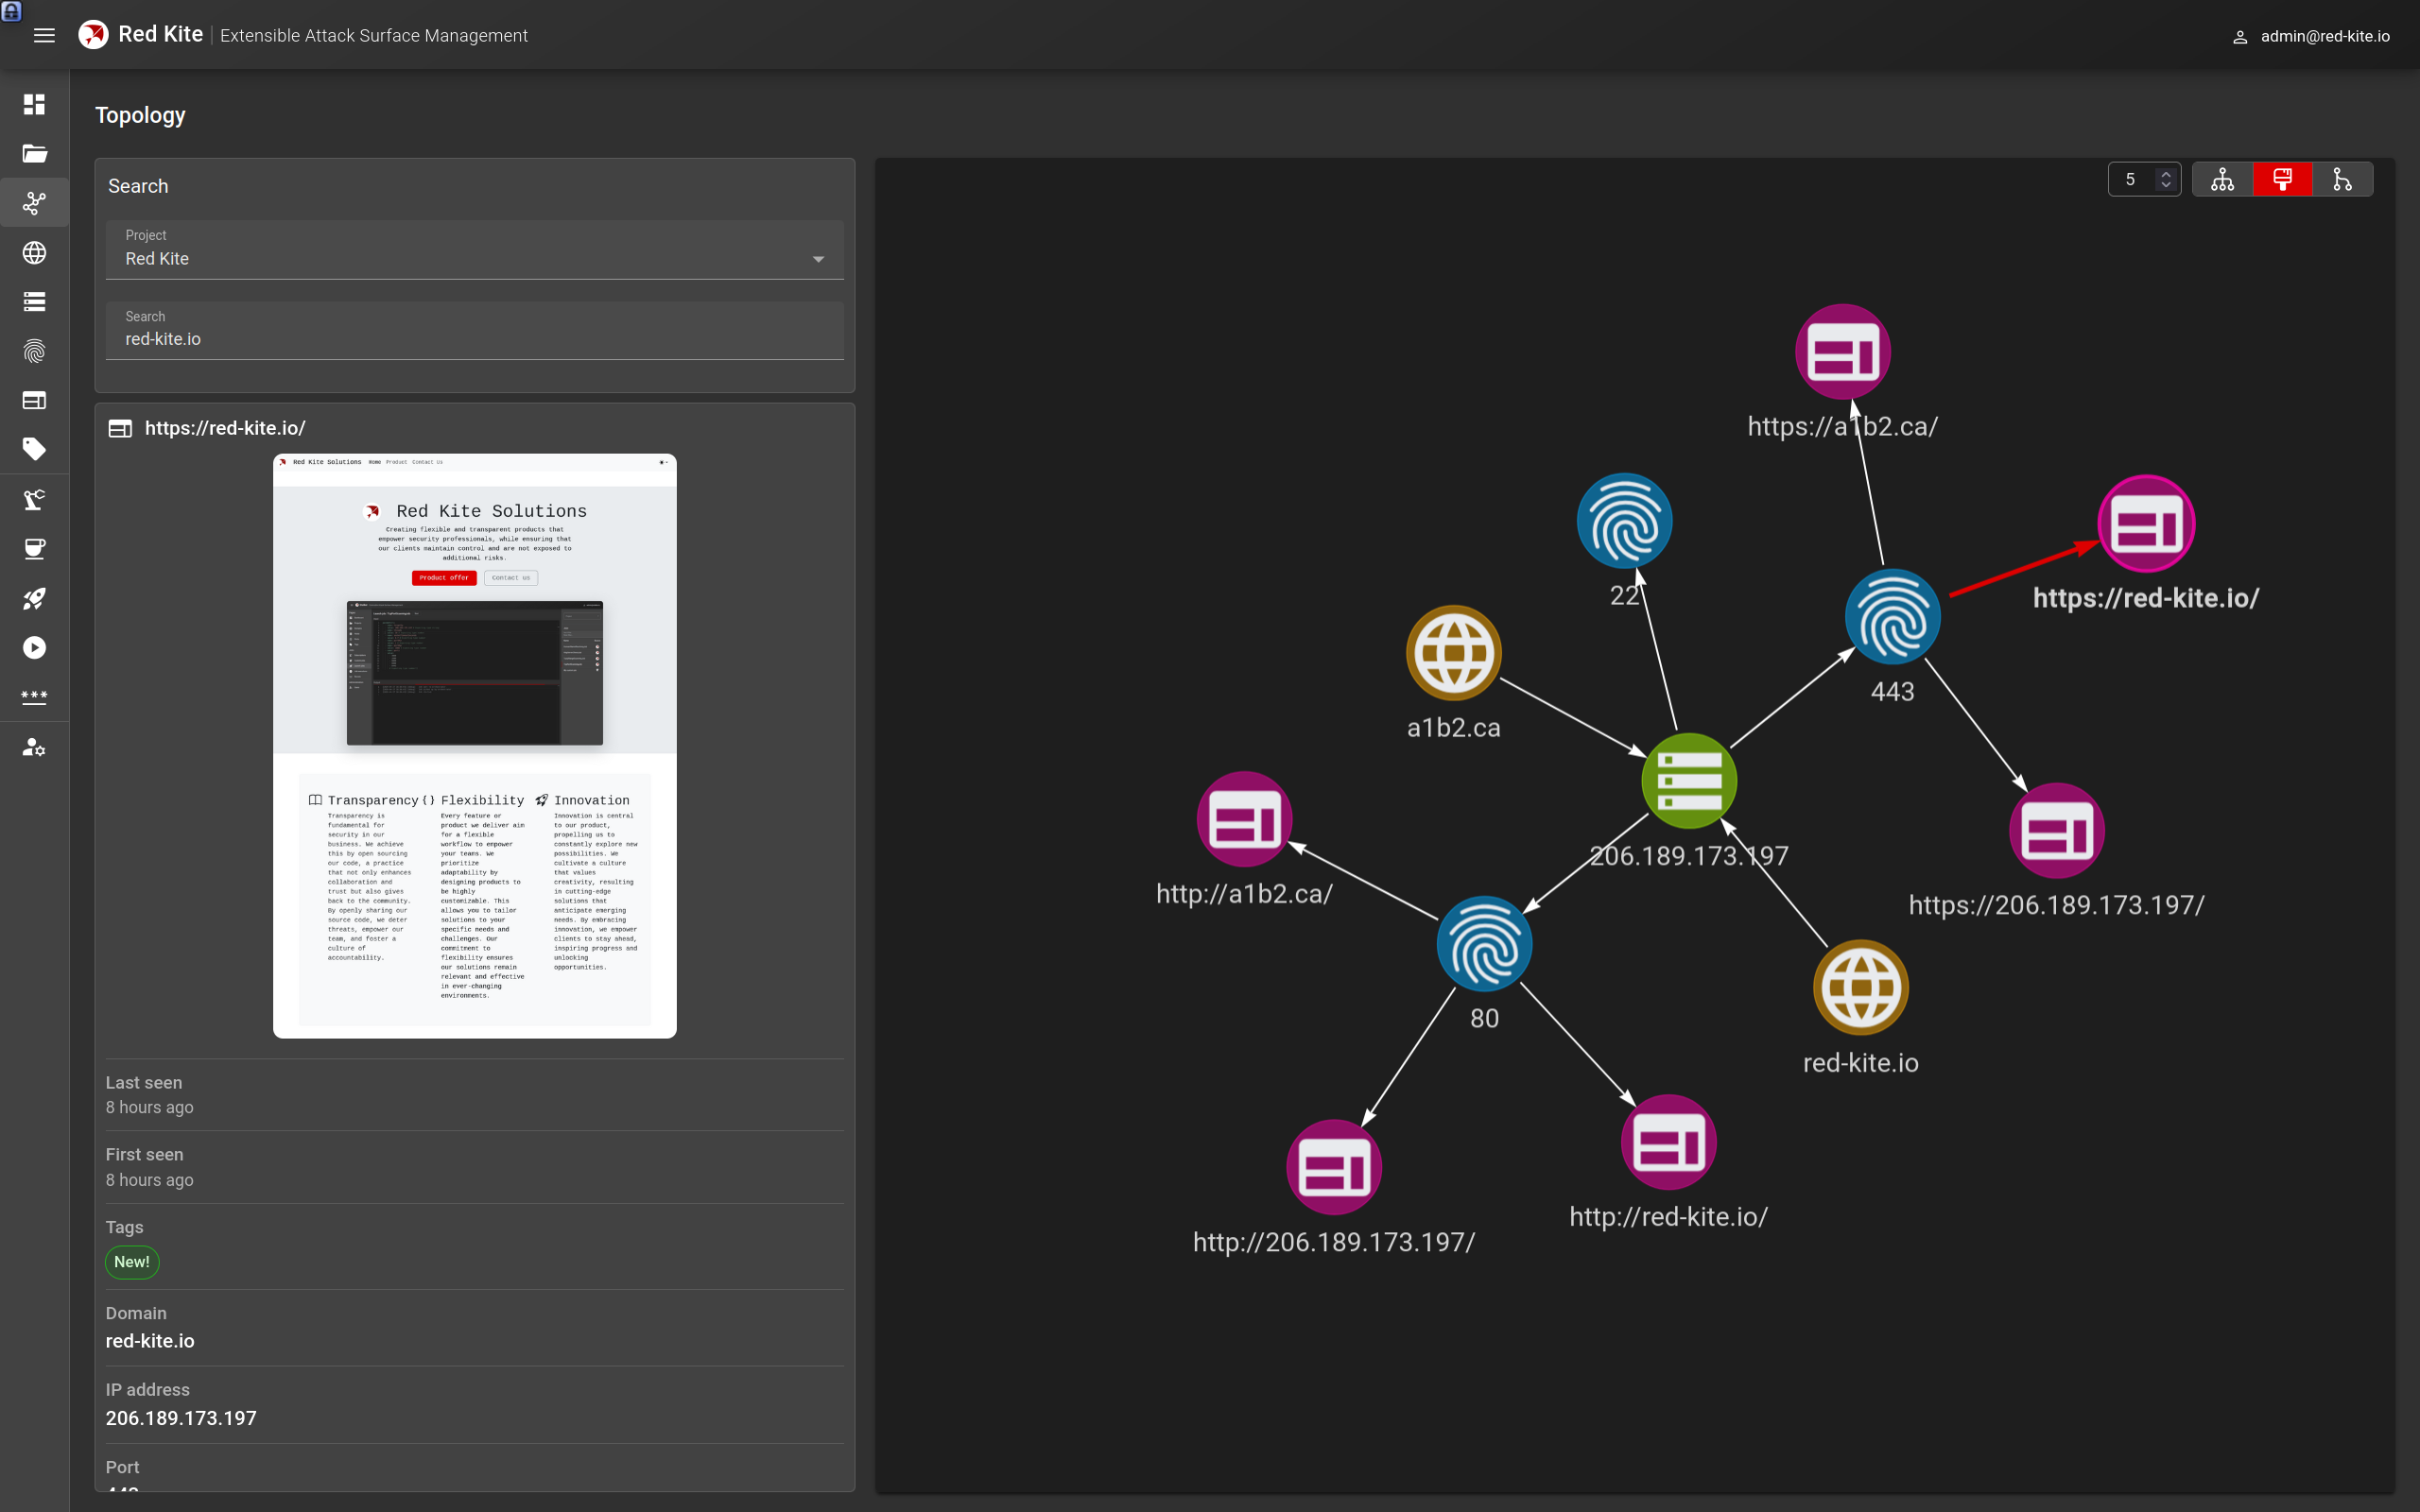
Graphs can also be generated in a tree format
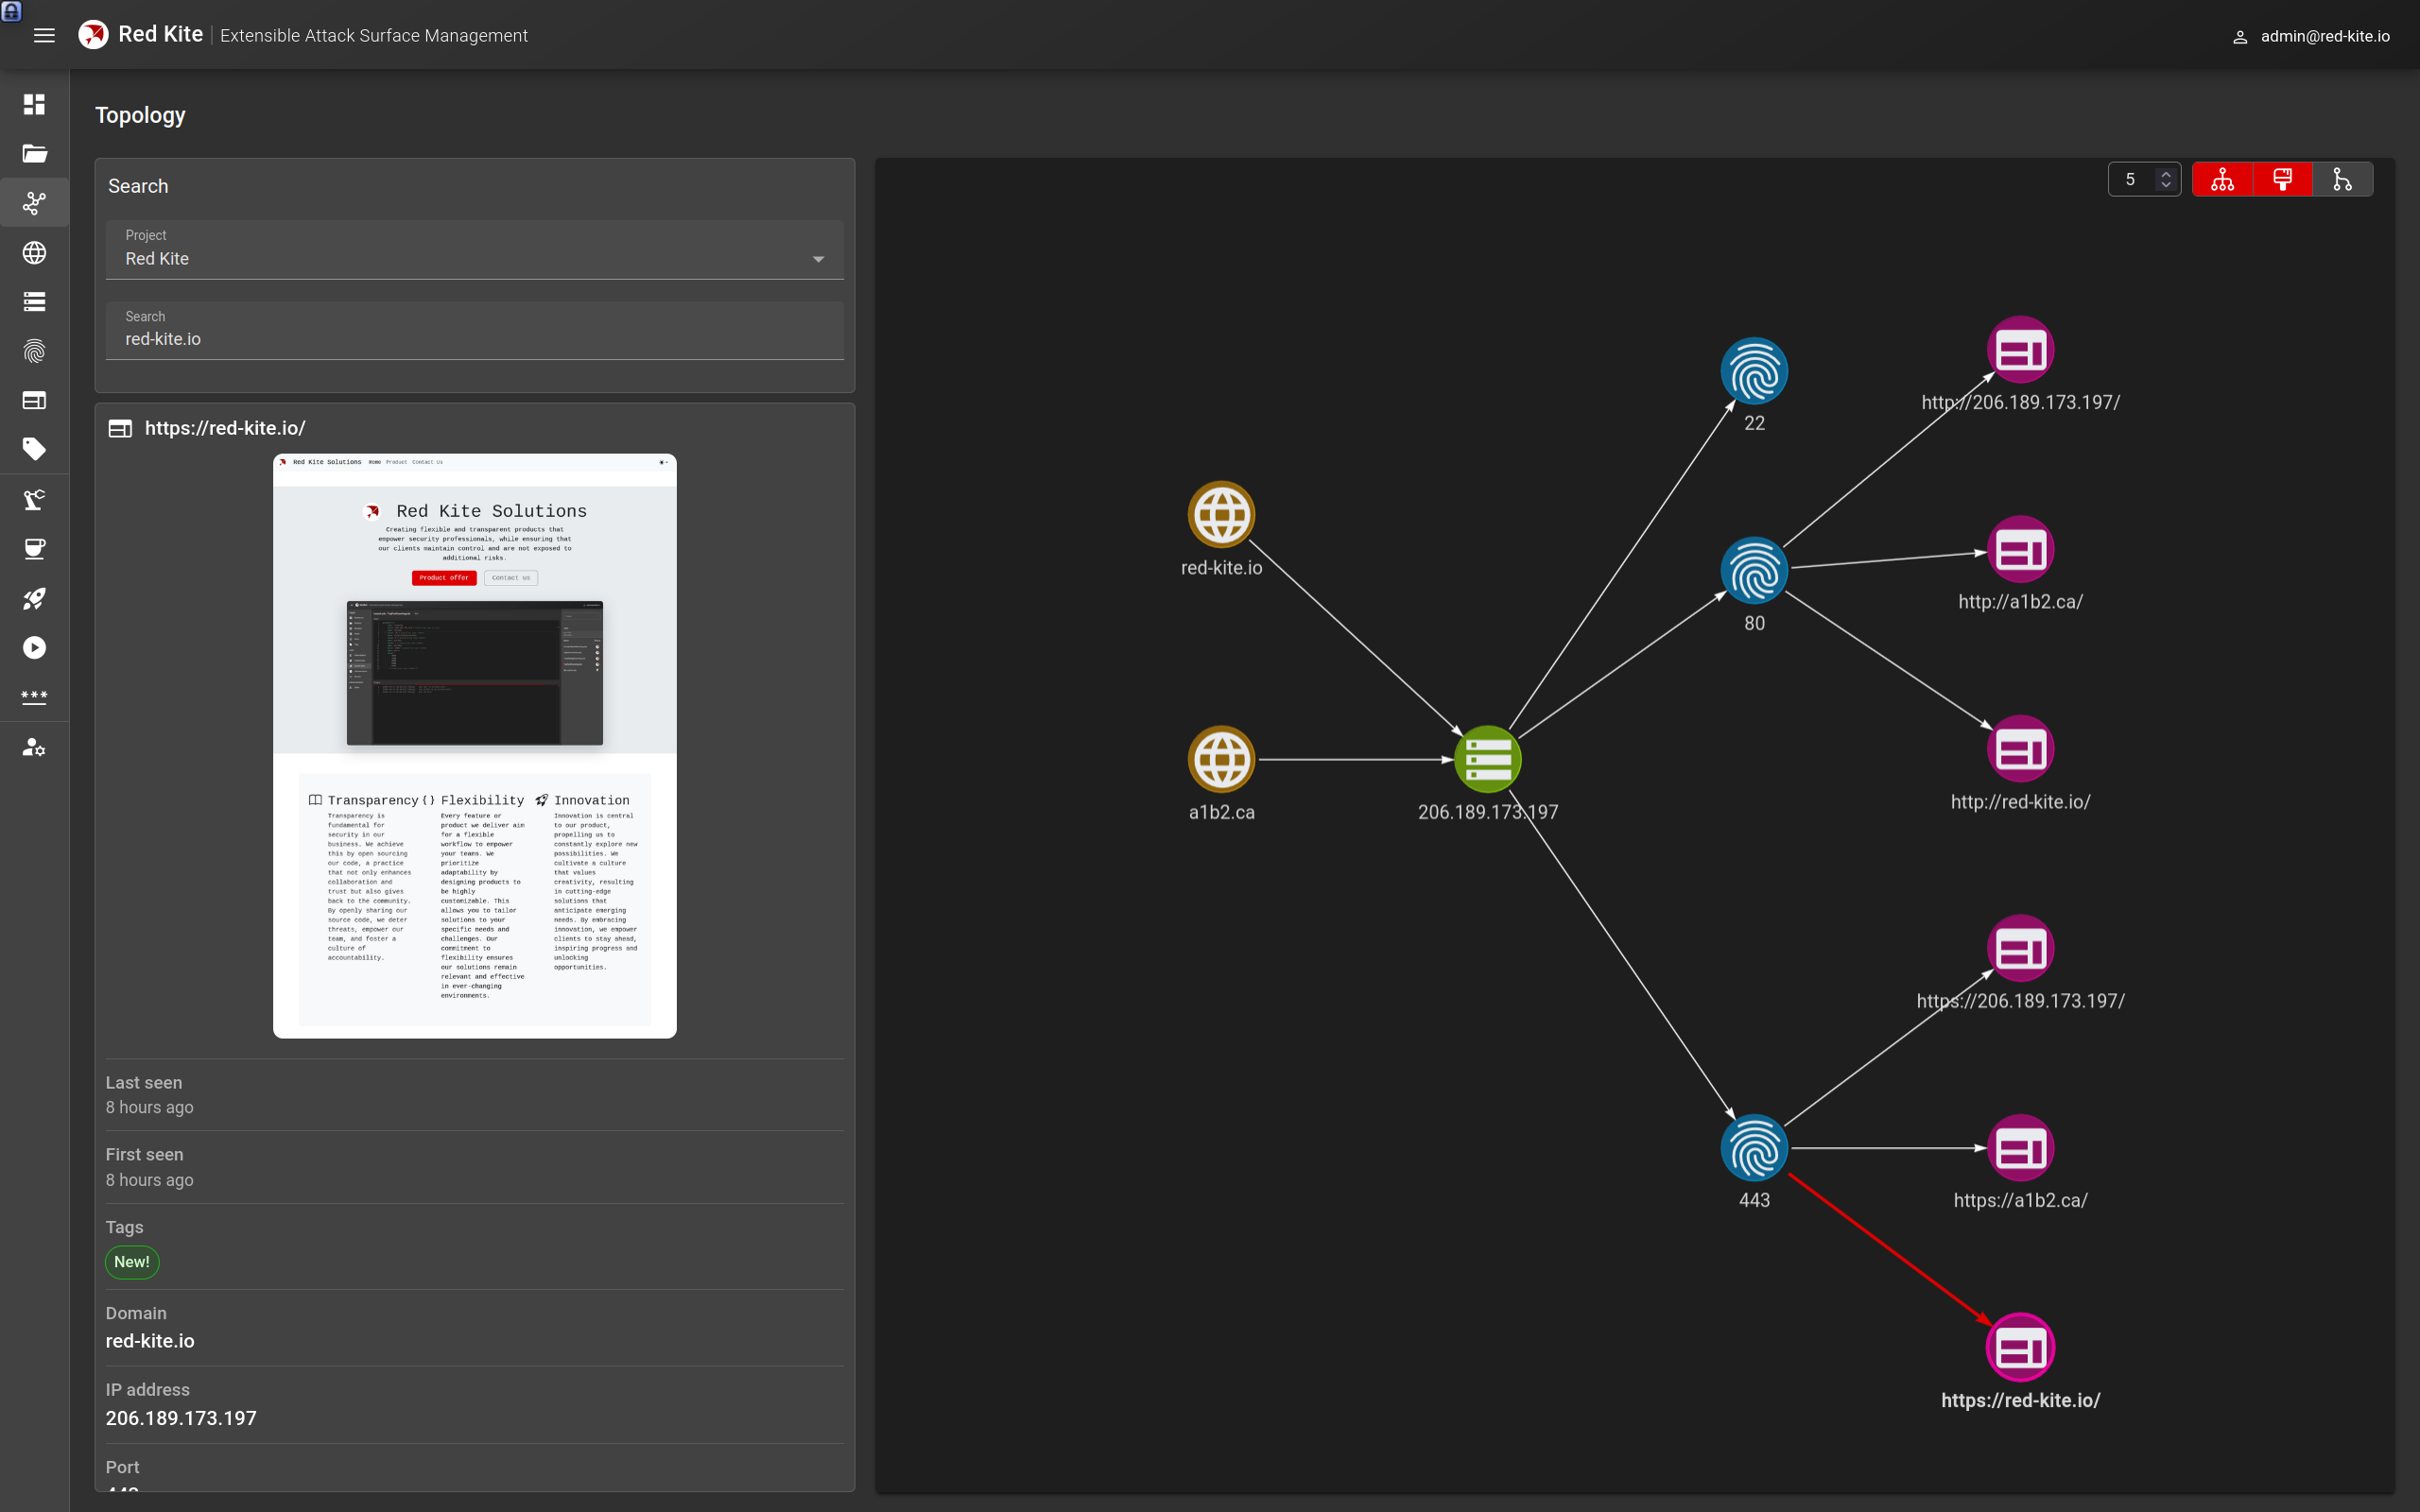
Other options, like removing the colors and curving the lines, are available through the graph buttons at the top.
When to use it
- Reviewing a resource you are not sure about. A host only linked to domains you do not know is probably not yours. See Data enrichment.
- Understanding the impact of a change. Before a cascading change, the graph shows which hosts, ports and websites are linked to a domain.
- Explaining your attack surface to a stakeholder, starting from one of their domains.